Are We All Just Advertising to Each Other?

Marketers promote safelists and traffic exchanges while others look bored or earn advertising credits.

Hello!

I’ve been involved with safelists and traffic exchanges for more than 20 years, and every once in a while I stop and think about what we’re actually doing.

We all want people to look at our advertisements.

So we click other people’s ads to earn credits, which we use to show our ads to people who are clicking to earn credits so they can show their ads to us.

Round and round we go.

It’s like walking into a room full of salespeople where everybody is trying to hand out business cards, but nobody particularly wants to take one.

Everybody’s selling.

But who’s buying?

Seriously. Are we actually advertising to potential customers, or are we just advertising to each other?

And if that’s what we’re doing, why does any of this work?

Let’s Admit Why Most of Us Are Here

I don’t think there’s much mystery about why people use safelists and traffic exchanges.

They’re trying to promote something.

Nobody wakes up in the morning thinking, “Boy, I can’t wait to look at 100 advertisements for random affiliate programs today!”

Well, maybe somebody does. I’ve met some pretty enthusiastic surfers over the years.

But I’m willing to bet most people wouldn’t spend nearly as much time looking at advertisements if there weren’t credits involved.

I certainly wouldn’t. I’ve spent plenty of years earning credits myself.

And there’s nothing wrong with that. It’s how these systems are designed to work.

But let’s not kid ourselves. Getting somebody to look at your advertisement because they want credits isn’t the same as getting somebody to look because they’re interested.

That’s a pretty important difference.

So are we all just wasting our time?

I don’t think so.

We’re Not Exactly Strangers

One thing that makes safelists and traffic exchanges interesting is that a lot of us know each other.

Maybe not personally. I’ve never met most of the people I see advertising every day.

But I recognize their names.

I recognize their websites.

I know which programs they’ve been promoting.

And when somebody I’ve seen around for years suddenly starts advertising something new, I notice.

That’s especially true when a new program launches.

You start seeing it everywhere. Familiar advertisers begin promoting it. People get curious. Some join. Others sit back and watch to see what happens.

There’s an entire little community operating underneath all those credits.

And I think that matters.

We’re not necessarily looking at thousands of completely anonymous advertisements. We’re repeatedly encountering people and businesses we’ve seen before.

Familiarity doesn’t automatically create trust. Somebody can become well-known for all the wrong reasons.

But recognition gives an advertisement something that a completely unfamiliar advertiser doesn’t have.

A history. A reputation. A reason for somebody to think, “Hey, what’s this person promoting now?”

That’s not something a traffic counter can easily measure.

Somebody Must Be Paying Attention

I’ve run enough advertising campaigns over the years to know that most visits don’t turn into anything particularly exciting.

But some do.

People sign up. They join mailing lists. They discover new programs. Sometimes they even spend money.

Last July, I ran my Safelist Attention Project through 45 safelists to see whether people were actually paying attention.

Instead of promoting a product, I sent visitors to a page where they could voluntarily click a button confirming they’d noticed it.

After cleaning up the data, I ended up with 8,392 visits and 143 deliberate button clicks.

That’s a 1.70% interaction rate.

Not exactly a number that makes you want to run out and buy a yacht.

But here’s the thing.

Nobody earned any extra credits for clicking that button. They’d already done what they needed to do to get their credits.

Yet 143 times, somebody took that extra step.

Does that mean the other 98.3% weren’t paying attention? Of course not. Some may have read the page and moved on.

But it does tell me that at least some people were doing more than blindly clicking their way through another batch of advertisements.

They were paying attention.

And that’s really all I’m getting at.

People can be clicking for credits and still notice something that interests them.

It happens.

Maybe We’re Advertising to Exactly the Right People

Here’s another possibility.

Maybe advertising to other advertisers isn’t nearly as ridiculous as it sounds.

Think about the things most of us promote.

Safelists. Traffic exchanges. Affiliate programs. Advertising tools. Autoresponders. Lead capture systems.

Who’s the ideal customer for something like that?

Probably somebody who already does online marketing.

And where do you find a concentrated audience of people actively involved in online marketing?

Well…

Safelists and traffic exchanges.

Imagine that.

Of course, this doesn’t mean every offer belongs here, or that every advertiser is going to succeed.

If you’re promoting the same tired opportunity that everybody has already seen 500 times, you’re probably going to have a hard time getting noticed.

But the same thing that makes this audience difficult to advertise to might also make it valuable.

These people understand online marketing. They need advertising. They use marketing tools. And many are always looking for the next interesting program.

Maybe the audience isn’t the problem.

Maybe we’re just not always giving them something worth noticing.

So, Are We All Just Advertising to Each Other?

Yes.

To a considerable extent, I think we probably are.

I’m not going to pretend otherwise. I own advertising sites myself, so I’m certainly part of the system.

Most of us are here to promote something, and the credits are what keep the whole thing moving.

But that doesn’t mean nothing worthwhile happens along the way.

People recognize names. They discover new programs. They follow what other marketers are doing.

They join things. Sometimes they buy things.

Most of the time, they’ll probably just collect their credits and move on. That’s the reality of this kind of advertising.

But every once in a while, something catches their attention.

Maybe the real problem isn’t that we’re advertising to each other.

Maybe it’s that too many of us forget there’s an actual person on the other side of the advertisement.

Someone with interests, problems, preferences, and money to spend.

They just happen to be earning credits while they’re doing it.

And that brings me to one final thought.

If you found this article through a safelist, there’s a pretty good chance you clicked the link because you wanted credits.

Yet here you are.

Reading an article about people clicking advertisements for credits.

There’s something wonderfully ridiculous about that.

And maybe it proves at least a small part of my point.

Yes, we’re advertising to each other. But “each other” isn’t nobody.

Thanks for reading,

Jerry

My Daily Mailer: Year 1

My Daily Mailer Year 1 featured image with a morning workspace, coffee, laptop, and sunrise view

My Daily Mailer is officially one year old.

That feels a little strange to write.

A year ago, I had an idea I thought was pretty cool. I knew how I wanted it to work. I had spent a lot of time thinking through the logic behind it.

But there is always one question you can’t answer until you put something in front of real people:

Will it actually work?

After one full year of My Daily Mailer, I finally have an answer.

I think it did.

And looking back through the numbers, I may actually like the idea behind it more now than I did when I launched it.

The Idea I Really Wanted to Test

I’ve been using safelists since 2003.

I’ve promoted on them, tracked them, written about them and operated them. I’ve watched the industry change quite a bit while the basic mechanics of a safelist stayed surprisingly similar.

One thing kept bothering me.

The economics of a traditional mailer don’t naturally balance themselves.

Members earn credits. Sites give away credits. Upgrades create credits. Promotions create credits. Balances accumulate.

Eventually, those credits turn into mail.

But there isn’t necessarily any connection between the amount of mailing power being created and the amount of activity available to support all that mail.

That was the problem I wanted to play with.

With My Daily Mailer, one Mail Token has a very specific value: one mailing.

But that’s not the clever part.

The part I still think is coolest is this:

The amount of MT members earn for reading changes based on how active the mailer is.

The economy responds to the mailer itself.

Member activity helps determine how much future mailing power gets created.

As conditions inside the site change, the earning rate can change with them.

Instead of constantly trying to force balance from the outside, the system is designed to move toward balance on its own.

It’s a little nerdy.

I know.

But I still love it.

The Members ARE the Economy

That’s also why My Daily Mailer depends so much on participation.

When somebody reads an email, they’re not simply clicking to collect an arbitrary pile of credits.

Their activity is part of the system.

Reading creates the conditions that allow mailing.

Mailing creates new messages to read.

Those reads create more mailing power.

And around it goes.

That’s the experiment I wanted to run.

Could a safelist economy regulate itself based on what the members were actually doing?

A year later, we’ve had enough real activity to give that idea a pretty serious test.

Year 1 By the Numbers

I pulled a full 365-day report directly from the My Daily Mailer database for this anniversary.

During Year 1:

  • More than 2,700 members joined My Daily Mailer
  • Members sent 28,305 mailings
  • Those mailings produced almost 15 million emails
  • Members earned 32,531 MTs
  • The mailer delivered more than 1.76 million reading hits
  • More than 100 members made upgrade payments

Those are real numbers from a real year of people actually using the site.

And I’m proud of them.

But there is another part of the report I like even more.

Month 12 Tells Me More Than Month 1

Launch numbers are fun.

They’re also dangerous.

You can launch something new and get a flood of curiosity.

People join because their friends are talking about it.

Affiliates promote it.

Everybody clicks around to see what’s new.

Then six months later…

Crickets.

So when I went through the Year 1 report, I wasn’t especially interested in proving that My Daily Mailer had a good launch.

I wanted to know what happened after everybody stopped caring that it was new.

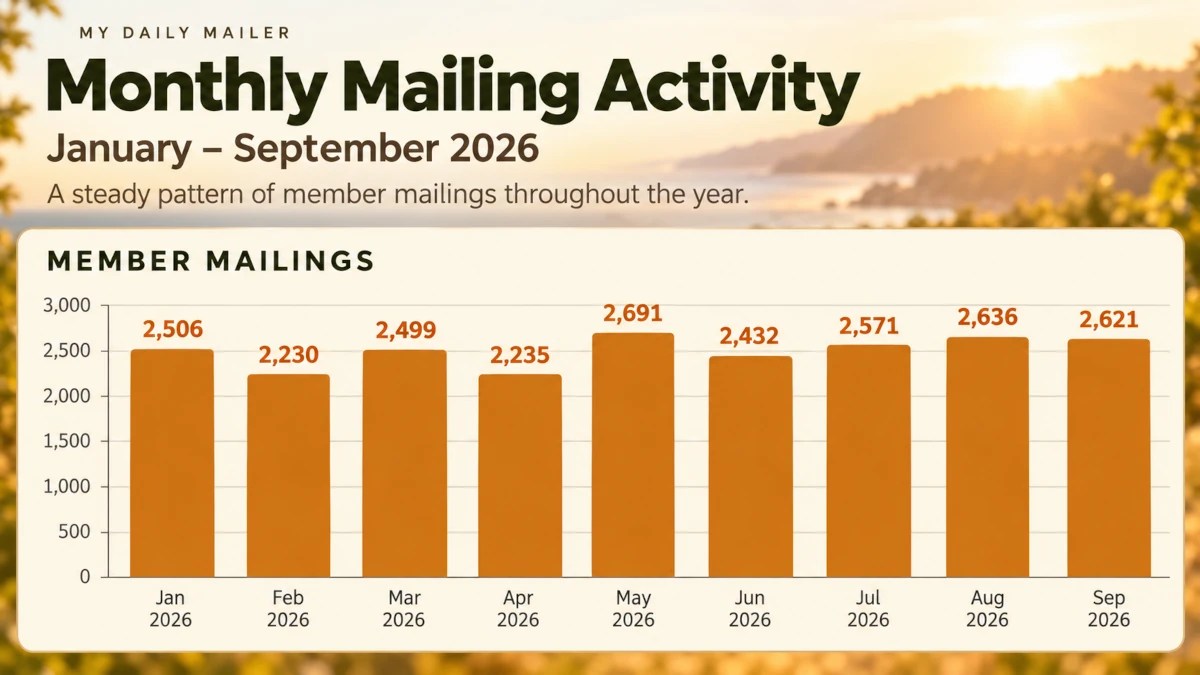
September 2026 was month twelve.

During that month, members sent 2,621 mailings.

Those mailings generated more than 1.35 million emails.

The system delivered 174,812 reading hits.

And on an average day, about 144 members were actively reading mail.

That’s month twelve.

Even more interesting, the mailing volume throughout 2026 was remarkably consistent.

Not one giant launch spike followed by a slow fade.

People found a rhythm.

They read.

They earned MTs.

They mailed.

Then they came back and did it again.

Some Members REALLY Use My Daily Mailer

The Year 1 report also reminded me how much of the site is driven by a relatively small group of extremely active members.

There were 270 members who completed at least 500 reads during the first year.

Together, those members accounted for more than 1.13 million completed reads.

And 243 of those heavy readers also sent mailings.

I love that.

Because that’s the system doing exactly what it was designed to do.

The people doing the reading aren’t trapped on one side of the equation.

They’re earning the ability to become senders themselves.

Read.

Earn.

Mail.

Repeat.

The economy keeps circulating.

And to those members who have spent hundreds—or thousands—of reads helping keep that cycle moving:

Thank you.

My Daily Mailer would just be software without you.

Then I Accidentally Tested It Against Everybody Else

One of my favorite moments of My Daily Mailer’s first year didn’t actually happen inside My Daily Mailer.

Earlier this year, I ran a safelist experiment for this blog.

I sent the same simple page through 40 different safelists.

There was no sale.

No opt-in.

No prize for clicking.

Visitors were simply asked to look at the page and choose whether they wanted to interact with it.

I wasn’t testing My Daily Mailer.

I wasn’t trying to prove anything about my own site.

I was testing attention.

And when I looked at the results, My Daily Mailer stood out.

By a lot.

Its visitors interacted with the page at a dramatically higher rate than the other safelists in the test.

Now, there are several possible reasons for that.

Members know me.

Lucky Letters give people a reason to pay attention.

The member base is active.

And the structure of the mailer may encourage a different kind of reading behavior.

I can’t separate all of those things perfectly.

But seeing My Daily Mailer stand out in an experiment I hadn’t designed to make it look good was pretty satisfying.

Especially because one of the things I wanted from the beginning was a mailer where activity actually meant something.

Year 1 Wasn’t Just Running the Site

Of course, I didn’t launch My Daily Mailer and then spend twelve months admiring it.

I tinkered with it.

A lot.

Lucky Letters became part of the experience.

I built a better contest system.

We now have reader contests and weekly reader sprints.

I added clearer guidance for new members who hadn’t yet figured out how to earn their first MT.

I watched the activation reports.

I changed things.

Then I watched again.

Some ideas worked.

Some didn’t.

Some things that seemed obvious to me were apparently not obvious at all once a new member landed on the site.

That’s one of the biggest differences between designing something and operating it.

Real members find every assumption you made.

That’s a good thing.

They make the product better.

The Site Is Still Evolving

My Daily Mailer is not finished.

I don’t really expect it ever to be.

That doesn’t mean I’m constantly trying to reinvent it.

The basic idea has held up remarkably well.

The self-balancing economy is still the part I believe in most.

But there are always ways to make the experience clearer, smoother, more useful or more fun.

Sometimes that means a new feature.

Sometimes it means changing a paragraph.

Sometimes it means staring at a report and realizing new members aren’t doing what I thought they were doing.

And sometimes it means spending far too long adjusting something that nobody except me will ever notice.

That’s part of running a site.

If You’ve Never Tried My Daily Mailer

If you’ve never joined, Year 2 seems like a pretty good time.

You can join for free.

You don’t need to understand the economics before you start using it.

Just read some member emails.

Watch your MT balance.

Earn a mailing.

Then use it.

You’ll figure out the rhythm pretty quickly.

And underneath that simple process is a system that’s constantly responding to the activity of the people using it.

That’s the part I’m proudest of.

Join My Daily Mailer

To Everyone Who Made Year 1 Possible

I built My Daily Mailer.

But I didn’t create what it became during Year 1.

The members did that.

Every person who opened an email helped create the economy.

Every person who sent a mailing gave somebody else something to discover.

Every affiliate who referred a member helped it grow.

Every Prime member who decided the site was worth paying for gave me another vote of confidence.

Every contest participant, Lucky Letter hunter and regular reader added a little more life to the place.

That’s what I see when I look at the Year 1 report.

Not 15 million emails.

People.

People using something I built.

People coming back.

People making the system work.

A year ago, My Daily Mailer was an idea I wanted to test.

Today, it’s a working mailer with thousands of members and a full year of real activity behind it.

That’s pretty awesome.

Thank you for Year 1.

Now let’s see what happens in Year 2.

— Jerry

My Daily Mailer

Almost Half My Attention Clicks Came From Just 20 Visitors

Small group of repeat visitors generating a large share of advertising engagement

My experiment recorded 143 attention clicks.

But they didn’t come from 143 different people.

They came from 94 distinct tracked visitors.

And just 20 of those visitors generated 69 of the clicks.

Almost half.

That was the final surprise in my Safelist Attention Project.


Most People Clicked Once. A Small Group Kept Clicking.

Throughout this experiment, I used a persistent browser cookie to identify returning visitors.

That doesn’t guarantee every visitor ID represents a completely separate physical person. Someone using another browser or device could receive another ID.

But it gave me a reasonable way to distinguish between a tracked browser appearing once and one coming back later.

Out of 7,380 distinct tracked visitor IDs, only 94 ever clicked the attention button.

Of those 94:

Clicker TypeTracked ClickersAttention ClicksShare of Clicks
Clicked once747451.7%
Clicked on multiple visits206948.3%
Total94143100%

That’s the number that really changed how I looked at the experiment.

74 tracked visitors clicked once and generated 74 clicks.

20 repeat clickers generated 69 clicks.

Nearly the same number of clicks.

From dramatically different numbers of people.


That Small Group Was Really Small

Those 20 repeat clickers represented only 21.3% of the people who clicked at all.

Yet they generated 48.3% of every attention click I recorded.

Put against the entire experiment, the number gets even more surprising.

There were 7,380 distinct tracked visitor IDs.

Only 20 became repeat clickers.

That’s about 0.27% of all tracked visitors.

Now, I want to be careful with that number.

I’m not saying 0.27% of the audience created half the value of the campaign.

They didn’t.

This experiment measured one very specific thing: whether somebody deliberately clicked the button telling me they had noticed the page.

What the number shows is much narrower—and still interesting:

A very small group generated a surprisingly large share of the measured interaction.


Repeat Clicking Usually Meant More Than One Extra Click

At first, I wondered if “repeat clicker” mostly meant somebody saw the experiment twice and clicked both times.

That did happen.

But it wasn’t the whole story.

Of the 20 repeat clickers:

  • 9 clicked twice
  • 11 clicked three or more times
  • several clicked four, five, or six times
  • one tracked visitor clicked on eight separate visits

So more than half of the repeat-clicker group interacted at least three times.

And the result wasn’t being distorted by one extreme visitor.

The most active tracked visitor produced eight clicks.

The remaining repeat clicks were spread across a small group that kept interacting when they encountered the experiment again.

Why?

I don’t know.

Maybe they recognized the experiment.

Maybe they enjoyed participating.

Maybe the page became familiar.

Maybe they remembered the unusual image.

Maybe they simply thought, “There’s Jerry’s experiment again. I’ll click the button.”

The experiment never asked them why they clicked again, so I don’t want to invent an explanation.

The safest conclusion is simply this:

The same tracked visitors remained willing to deliberately interact on later visits.


Most Returning Visitors Still Never Clicked

There’s another number that keeps all of this in perspective.

In my previous post, How Many Times Did People See My Ad Before They Clicked?, I looked at when people first responded.

There were 288 tracked visitors who appeared more than once during the experiment.

But returning did not automatically mean engaging.

Of those 288 repeat visitors:

  • 247 never clicked
  • 21 clicked on exactly one visit
  • 20 clicked on multiple visits

So only 6.9% of all returning visitors became repeat clickers.

That’s important.

I don’t want to look at these numbers and say:

“Just keep showing people the same ad and they’ll eventually become highly engaged.”

The data doesn’t say that.

Most returners still never clicked.

What happened instead was that a relatively small subgroup behaved very differently from everybody else.


Ten Clicks Can Tell Two Completely Different Stories

This may be the most useful lesson I’ve taken from this final part of the experiment.

Imagine two campaigns.

Campaign A gets 10 clicks from 10 different people.

Campaign B gets 10 clicks from three people who keep returning and interacting.

If you’re only looking at the click counter, both campaigns say:

10 clicks.

But those numbers are telling very different stories.

Campaign A shows more breadth.

Campaign B shows more repeat engagement.

Which would I rather have?

That depends on what I’m trying to accomplish.

If I’m looking for new leads, I’d probably be more interested in reaching more different people.

If I’m trying to build recognition or familiarity, repeat interaction may also be useful.

And if I’m trying to make sales?

Then neither number tells me enough.

I’d want actual conversion data.

That’s something this experiment has kept reminding me:

The value of a metric depends on what you’re trying to learn from it.


Different Safelists Produced Different Patterns

This also helped explain something I had noticed earlier in the project.

Not every safelist produced the same kind of attention.

Mister Safelist generated 14 attention clicks from 14 different tracked visitors.

That’s broad participation.

SendCircle produced 32 clicks from 20 tracked clickers, including five repeat clickers who generated 17 clicks between them.

My Daily Mailer showed a similar mix: 30 clicks from 19 tracked clickers, with five repeat clickers generating 16 clicks.

Then there were sources such as Zodiac Mailer, where eight clicks came from two tracked visitors who both interacted repeatedly.

I don’t look at those patterns as better or worse.

They’re different.

One source may produce broader participation.

Another may produce stronger repeat engagement from a smaller responsive group.

The important thing is that the total click number by itself doesn’t show the difference.


Why I Want Two Numbers From Now On

Before this experiment, if somebody told me an ad received 100 clicks, my first instinct would probably be to compare that number with another source that received 80 or 120.

Now I want another number sitting beside it:

How many different tracked visitors produced those clicks?

Because:

100 clicks from 100 people tells me one story.

100 clicks from 50 people tells me another.

100 clicks from 20 people tells me something else entirely.

None of those outcomes is automatically good or bad.

But without knowing both total clicks and unique clickers, I don’t really know what kind of response I’m looking at.

That’s a lesson I can use far beyond safelists.

The same idea could matter with email, content marketing, recurring advertising, social media, or anywhere else people can interact with something more than once.


One More Interesting Connection To The Eyes

There was one other result I couldn’t help noticing.

Earlier in this series, I looked at what people said made them notice the experiment page.

The eyes in the image barely won among people’s first responses.

But among the 29 additional follow-up answers submitted by repeat respondents, 21 selected the eyes.

That doesn’t prove the eyes caused repeat engagement.

It doesn’t even prove they were the reason somebody remembered the page.

But it does make me wonder whether that visual became especially recognizable once people had seen the experiment before.

Maybe the creative wasn’t only noticeable.

Maybe, for some people, it became familiar.

That’s something I’d have to test separately.


What This Doesn’t Prove

There are a few important limits to these results.

The visitor IDs were cookie-based, so they represent tracked browsers rather than guaranteed individual human identities.

A repeat click does not equal a new lead, a sale, or stronger buying intent.

The experiment didn’t ask people why they clicked again.

Visitors weren’t randomly assigned a certain number of exposures.

And this wasn’t a normal sales page.

The page openly told people they were part of an experiment and asked them to click a button if they noticed it.

Someone who returned later may simply have recognized the page and remembered what I was asking them to do.

That’s still deliberate interaction.

But I wouldn’t assume a commercial offer would produce exactly the same behavior.


What This Whole Experiment Changed For Me

When I started this project back in July, I really thought I was going to find out which safelists were best at getting attention.

I did learn quite a bit about the safelists.

But that wasn’t the most interesting part.

I learned that traffic and attention aren’t the same thing.

I learned there can be more than one kind of winner, depending on what I measure.

I learned that people notice different things.

I learned that some people don’t respond the first time they see an ad.

And now I’ve learned that even after people do respond, the attention itself isn’t necessarily spread evenly.

Some of it was broad.

Some of it came from repeat engagement.

Some visitors never responded at all.

And a very small group generated a surprisingly large share of the visible activity.

I started with a traffic question.

I ended up with a measurement lesson.

The number on the counter is only the beginning of the story.

From now on, if I see that an ad got 100 clicks, I don’t think I’m going to be satisfied with knowing there were 100 clicks.

I’m going to want to know one more thing:

Who produced them?

That’s probably the biggest lesson I’m taking away from the Safelist Attention Project.

Don’t just count the clicks. Understand who is producing them.

And with that, I’m going to call this the final core article in this experiment.

I’ve gotten far more out of that strange little page than I expected when I started sending it through safelists in July.

I’m not finished experimenting, though.

So now I’d like to turn the next one over to you.

If I run another marketing attention experiment, what would you like me to test?

Different headlines?

Different images?

Short emails versus long emails?

Curiosity versus benefits?

A plain page versus a designed page?

Whether attention actually predicts conversions?

Leave me a comment and let me know.

Your idea might become my next experiment.

Thanks for following along,

Jerry

How Many Times Did People See My Ad Before They Clicked?

Repeated ad exposures showing the second view getting noticed while later exposures fade.

In my last post, I looked at what made people notice the page in my Safelist Attention Project.

This time, I wanted to answer a different question:

What happened when somebody saw the page more than once?

If they didn’t click the first time, was that opportunity gone?

Or could another exposure give the ad a second chance?

Most People Only Saw It Once

The final analysis included 8,392 recorded visits from 7,380 tracked visitor IDs.

Most of them appeared only once.

  • 7,092 appeared once
  • 288 appeared more than once

So only about 3.9% of the tracked visitors returned for another recorded exposure.

For this article, an exposure simply means another recorded page load under the same visitor ID.

That could have come from another mailing, a return visit, a delayed click, or even a refresh. It does not necessarily mean somebody received the exact same email twice.

When Did People First Click?

There were 94 distinct tracked visitors who clicked the attention button at least once.

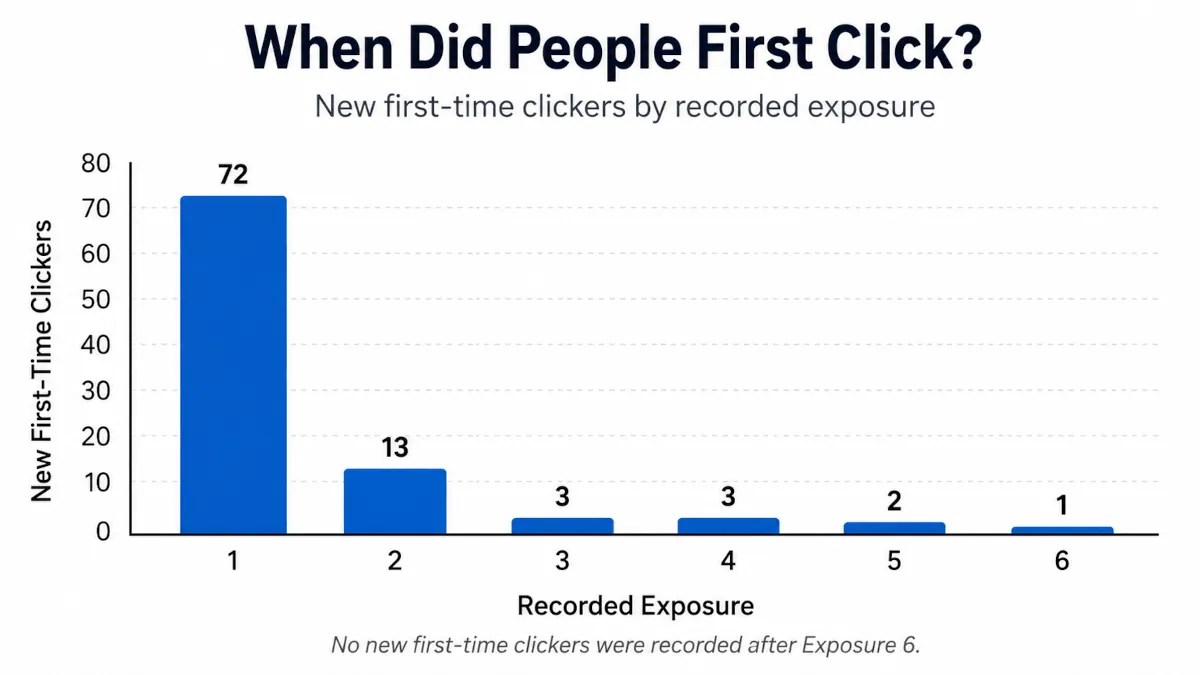
Here’s when they clicked for the first time:

Bar chart showing 72 first clicks on exposure one, 13 on exposure two, then 3, 3, 2 and 1.

The biggest takeaway is obvious.

72 of the 94 people who eventually clicked did it on their first recorded exposure.

That’s 76.6%.

So most of the attention happened right away.

But that also means 22 people — 23.4% of all eventual clickers — did not respond the first time.

Nearly one-quarter of the people who eventually clicked needed another opportunity.

That seems worth paying attention to.

The Second Exposure Was Especially Interesting

On Exposure #1, all 7,380 tracked visitors were eligible to become first-time clickers.

72 clicked.

That works out to a first-click rate of about 0.98%.

Now look at Exposure #2.

Among people who returned without having clicked the first time, 269 were still eligible to become first-time clickers.

13 of them clicked.

That works out to 4.83%.

So the first-click rate among those returners was nearly five times the rate on the first exposure.

That sounds dramatic.

But there’s an important catch.

The Second Group Was Different

I’d love to say the second exposure made people five times more likely to click.

The numbers don’t quite let me say that.

Everybody was included in Exposure #1.

Exposure #2 only included people who came back.

Those people may have been more active safelist users, more curious, more likely to revisit pages, or exposed to my campaign differently.

They were a self-selected group.

I didn’t randomly divide people into a “see it once” group and a “see it twice” group.

So this does not prove that repetition caused the higher click rate.

What it does show is that among the people who naturally returned without responding the first time, the second encounter created quite a few new responses.

That alone is useful.

A First Non-Response Wasn’t Always the End

This may be the most practical lesson for me.

It’s easy to run an ad, see that somebody didn’t respond, and assume the message failed.

Sometimes that may be true.

But in this experiment, 22 eventual clickers passed through once without clicking and responded later.

Thirteen responded on Exposure #2.

Another nine responded after that.

I can’t say exactly why.

Maybe the page looked more familiar.

Maybe they were less distracted the next time.

Maybe curiosity had another chance to work.

I don’t know.

What I do know is that one missed opportunity did not always mean the ad had lost them forever.

But More Repetition Wasn’t Automatically Better

The extra response also faded pretty quickly.

After the 13 new clickers on Exposure #2, the numbers dropped to:

  • 3 on Exposure #3
  • 3 on Exposure #4
  • 2 on Exposure #5
  • 1 on Exposure #6
  • 0 after that

In this dataset, every tracked visitor who eventually clicked had done so by their sixth recorded exposure.

I would not turn that into some kind of “six exposure rule.”

The later groups were small, and this was one unusual advertising experiment.

To me, the pattern is simpler:

The first exposure did most of the work. The second created another useful opportunity. After that, new response became increasingly rare.

So How Long Should You Keep Running an Ad?

I don’t think this experiment gives us one perfect number.

What it does suggest is a reasonable middle ground.

If you have an ad that you believe is strong, don’t necessarily abandon it just because someone didn’t respond the first time.

Give it another chance.

Maybe even a few.

But don’t use repetition as an excuse to run the same ad forever either.

Eventually, you may be better off testing another headline, changing the creative, rotating the ad, or bringing it back again later.

For me, the takeaway is:

A first non-response is not always the end of the story.

Most people who noticed my experiment responded right away.

Some responded only after seeing it again.

And eventually, the supply of new attention dried up.

That feels a lot more useful than trying to force the results into some magic advertising rule.

There’s one more strange pattern hiding in the repeat-visitor data.

A small group didn’t just return and click for the first time.

They kept clicking on later visits even after they had already responded once.

That’s what I’m going to look at next.

What Made People Notice My Ad? The Eyes Barely Won.

Close-up eyes surrounded by email and advertising graphics representing what gets noticed online

I’ve spent a lot of time thinking about what makes an ad stand out, but this time I had something better than another theory: I could ask the people who actually noticed mine.

After somebody clicked the button on my safelist experiment page, I asked one more question:

What made you notice this page?

I gave them seven choices:

  • The email subject
  • The email itself
  • The headline
  • The eyes
  • The page design
  • Just curious
  • Other

By the end of the experiment, I had collected 105 answers.

And at first, the winner looked pretty obvious.

The eyes received 43 selections.

The next closest answer, the page design, received only 21.

So there you go.

Put a giant pair of eyes on every ad you create and retire rich.

Well…

Not quite.

Once I started looking more carefully at where those 105 answers came from, the result became a lot more interesting.

105 Answers Did Not Mean 105 Different People

This is one of those little details that can completely change how you interpret an experiment.

The 105 answer records came from 76 distinct tracked respondents.

Some people encountered the experiment more than once. If they clicked the attention button again on another visit, they could answer the follow-up question again.

Fourteen tracked respondents submitted more than one answer.

Altogether, those repeat participants created 29 additional answer records beyond their first responses.

That means I didn’t want to simply treat all 105 answers as though 105 different people had independently selected an answer.

So for the main comparison in this article, I used only the first recorded answer from each of the 76 distinct tracked respondents.

And suddenly, the eyes didn’t look nearly as dominant.

safelist attention project splash page
The page used for the Safelist Attention Project. Visitors were asked to confirm that they had deliberately noticed it.

What Did People Say Made Them Notice the Page?

Here is what the first answer from each of those 76 tracked respondents looked like:

RankAnswerRespondentsShare
1The eyes2228.9%
2The page design2127.6%
3The headline1317.1%
4 tieThe email subject810.5%
4 tieJust curious810.5%
6 tieThe email itself22.6%
6 tieOther22.6%

Now that’s a much different story.

The eyes still finished first.

But only by one respondent.

Twenty-two people credited the eyes.

Twenty-one credited the overall page design.

That is basically a tie.

And I think that’s more useful than the original 43-to-21 comparison.

what people said made them notice

The Eyes Won… But They Didn’t Win the Way I Expected

I went into this experiment expecting the eyes to play a major role.

The page was deliberately unusual.

There was no sales pitch.

No opt-in form.

No income claim.

Not even a product to buy.

Instead, the page told people they were part of an experiment, showed a very noticeable pair of eyes, and asked them to click a button if they had actually stopped long enough to notice what they were seeing.

If you haven’t seen the original experiment yet, I explained the full setup in the first post in this series.

Looking only at all 105 recorded answers, my original assumption seemed completely justified:

  • The eyes: 43 answers
  • Page design: 21
  • Headline: 17
  • Email subject: 12
  • Just curious: 8
  • Email itself: 2
  • Other: 2

But something interesting happened among the repeat participants.

Of the 29 additional answers submitted after a respondent’s first answer:

21 selected the eyes again.

The other eight were split between the headline and email subject.

None of the additional answers selected page design.

So repeat participants were especially likely to select the eyes again.

Maybe that means the eyes were particularly memorable.

Maybe they continued to stand out when someone saw the experiment again.

Or maybe there is another explanation I haven’t considered.

The data can’t tell me exactly why.

But it does explain why the eyes look so overwhelmingly dominant in the full 105-answer total while barely edging out the page design when I count each tracked respondent only once.

what drew attention most often

Nearly Three-Quarters Credited Something on the Page

There is another way to look at these answers that I think may be even more useful.

I grouped the choices into three broad categories.

Page elements

  • The eyes: 22
  • Page design: 21
  • Headline: 13

Total: 56 of 76 respondents — 73.7%

Email elements

  • Email subject: 8
  • Email itself: 2

Total: 10 of 76 — 13.2%

Curiosity or other

  • Just curious: 8
  • Other: 2

Total: 10 of 76 — 13.2%

So when I asked these respondents what made the page noticeable, almost three out of four credited something they were seeing on the landing page itself.

I want to be careful with that conclusion.

It does not mean the email was unimportant.

Without the email, most of these people would never have reached the page in the first place.

The survey was also asked after they had already arrived and interacted with the page. The page was right there in front of them, while the email they had just left was no longer visible.

So there is probably some recency involved too.

Still, I think the result says something useful:

The email opened the door. Once they arrived, the page itself received most of the credit for getting noticed.

That fits nicely with something I found earlier in this experiment.

As I discussed in More Traffic or More Attention?, simply getting somebody to a page is not the same thing as getting their attention once they arrive.

This survey gave me a glimpse into what the people who did pay attention believed had helped.

The Eyes Were Part of the Design

It would be easy to turn this into an eyes-versus-page-design contest.

I don’t think that would be very useful.

The eyes were part of the page design.

They didn’t exist in isolation.

They were surrounded by a clean layout, a headline explaining what was happening, a short amount of text, and one very obvious green button.

So when 22 people picked the eyes and another 21 picked the page design, I don’t see those as two completely separate things fighting for first place.

My interpretation is more like this:

The eyes may have stopped them, but the rest of the page gave them a reason to stay long enough to click.

I can’t prove that’s exactly what happened.

But it makes more sense to me than concluding that everybody should start pasting giant eyeballs onto their splash pages.

Although I admit that would make safelist emails a little more entertaining.

The Headline Wasn’t Exactly a Loser Either

The headline finished third with:

13 of 76 respondents — 17.1%

That’s roughly one out of every six people.

I wouldn’t dismiss that.

One mistake I could make here would be to say that the experiment proves images beat words.

It doesn’t.

The visual may have been the first interruption.

The page design may have helped organize everything.

But the headline helped explain what the person was looking at.

That is an important job.

This is something I’ve been thinking about more lately when it comes to what actually makes people stop and notice an ad.

A visual can make someone look.

But after you get that split second of attention, something still has to make sense.

The headline is often where that happens.

The Subject Line Beat the Email Body Four to One

The email results were also interesting.

Among the 76 first responses:

  • 8 chose the email subject
  • 2 chose the email itself

So the subject line was selected four times as often as the actual email.

Again, I don’t think the lesson is to stop caring about your email copy.

The email had already done its job by getting somebody to click through.

In this particular campaign, the subject line may have been the beginning of the attention sequence.

It created enough interest to get the email opened.

The email created enough interest to get the page opened.

Then the landing page had to do something with that opportunity.

That is probably a better way to think about the whole process than trying to identify one single magical element.

People Who Chose the Eyes Also Clicked Sooner

There was one more piece of data I wanted to look at.

Because I recorded the page visit and attention click separately, I could calculate how much time passed between the recorded page load and the click.

Again, I used each respondent’s first reason answer.

The median times looked like this:

What they creditedRespondentsMedian time to attention click
The eyes2212 seconds
The headline1332 seconds
Page design2140 seconds
Email subject840 seconds
Just curious853 seconds

The people who credited the eyes tended to interact with the page much sooner.

Their median time from page load to clicking the attention button was only 12 seconds.

That is interesting.

But there is an important limitation.

This does not mean the eyes made somebody notice the page exactly 12 seconds after arriving.

I don’t know the exact moment attention began.

Someone could have opened the page in another tab.

They could have gotten distracted.

They could have come back later.

So I think the safest conclusion is simply:

People who credited the eyes tended to interact with the page sooner.

That certainly fits the idea of the eyes acting as a quick visual focal point, but I wouldn’t take it much further than that.

What I Would Take Into My Next Ad

The more I look at these results, the less interested I am in finding one winner.

I think the useful lesson is in how the pieces worked together.

If I were designing my next ad based on this experiment, here is what I would keep in mind.

Give the page one obvious visual focal point.

Something should immediately stand out from everything around it.

Don’t expect that focal point to rescue a weak page.

The overall design received almost exactly as much credit as the eyes.

Use the headline to explain or strengthen the visual.

One out of six respondents specifically credited the headline.

Make the next action obvious.

The experiment page didn’t make people hunt for what to do next.

There was one clear button.

Treat the subject line as the beginning of the experience.

The page doesn’t exist in a vacuum. The first opportunity to earn attention may happen before somebody ever reaches it.

And maybe most importantly:

Look at the entire path instead of optimizing each piece separately.

Subject line.

Email.

Landing page.

Visual.

Headline.

Action.

They all hand attention from one step to the next.

That is probably a better lesson than trying to discover whether eyes are 1.3% more powerful than some other picture.

What This Experiment Cannot Tell Me

As interesting as these results are, there are some limits worth remembering.

Only people who clicked the attention button were shown the follow-up question.

So these answers do not represent all 8,392 analyzed visits from the experiment.

They represent the respondents who had already deliberately interacted with the page.

The answers were also self-reported.

People told me what they believed made them notice the page. That does not prove that the selected item actually caused their attention.

The answer choices were predetermined.

There was an “Other” option, but I did not collect a written explanation with it, so I have no idea what those two respondents meant.

And because the page was still visible when the question was asked, it is possible those elements were simply easier to remember than the email that came before them.

This was also one page, one campaign, and one particular audience.

I would test these ideas again before treating any of them as universal rules.

So… Did the Eyes Work?

Yes.

I think it would be difficult to look at these results and say the eyes didn’t matter.

They finished first among distinct tracked respondents.

They were selected repeatedly by people who encountered the experiment more than once.

And respondents who credited the eyes tended to click sooner.

But the page design finished only one respondent behind them.

The headline mattered to a meaningful group too.

And even the email subject had a role before the page ever got a chance to do its job.

So I don’t think the lesson from this experiment is:

Use eyes.

I think it’s something closer to this:

Something has to interrupt the pattern.

Something has to make what you’re seeing understandable.

And something has to give you a reason to do something next.

The eyes may have been the first part of that sequence.

But they weren’t working alone.

In the last article, I found that there wasn’t just one way for a safelist to “win” the experiment.

Apparently, there wasn’t just one way for the ad itself to win attention either.

And that brings me to the next thing I want to look at.

Some people clicked the first time they saw the experiment.

Others didn’t respond until they encountered it again.

So next, I’m going to dig into repeat exposure.

Did seeing the same page a second time increase the chances that somebody would finally notice it?

And if repetition helped, how long did it keep helping before it stopped producing new attention?

That’s where I’m going next.